
My First Web App
Web app development frameworks are increasing in popularity and provide a neat resource for deploying data on the web. I take my first step in learning how it works and creating my first app.
My first web app was born from a visualization project I had been working on.
In my efforts to learn R's {ggplot2} visualization package, I focused on geospatial data. I designed a neat looking plot to visualize state level populations by county relative to the mean.
Adjusting the parameters to plot for new states was painstaking, but it provided the opportunity to move the code to a shiny app. Here's how I got started!
Basic App Construction
Throughout my research and practicing, I discovered a handful of elements that comprise the structure and implementation of a shiny app.
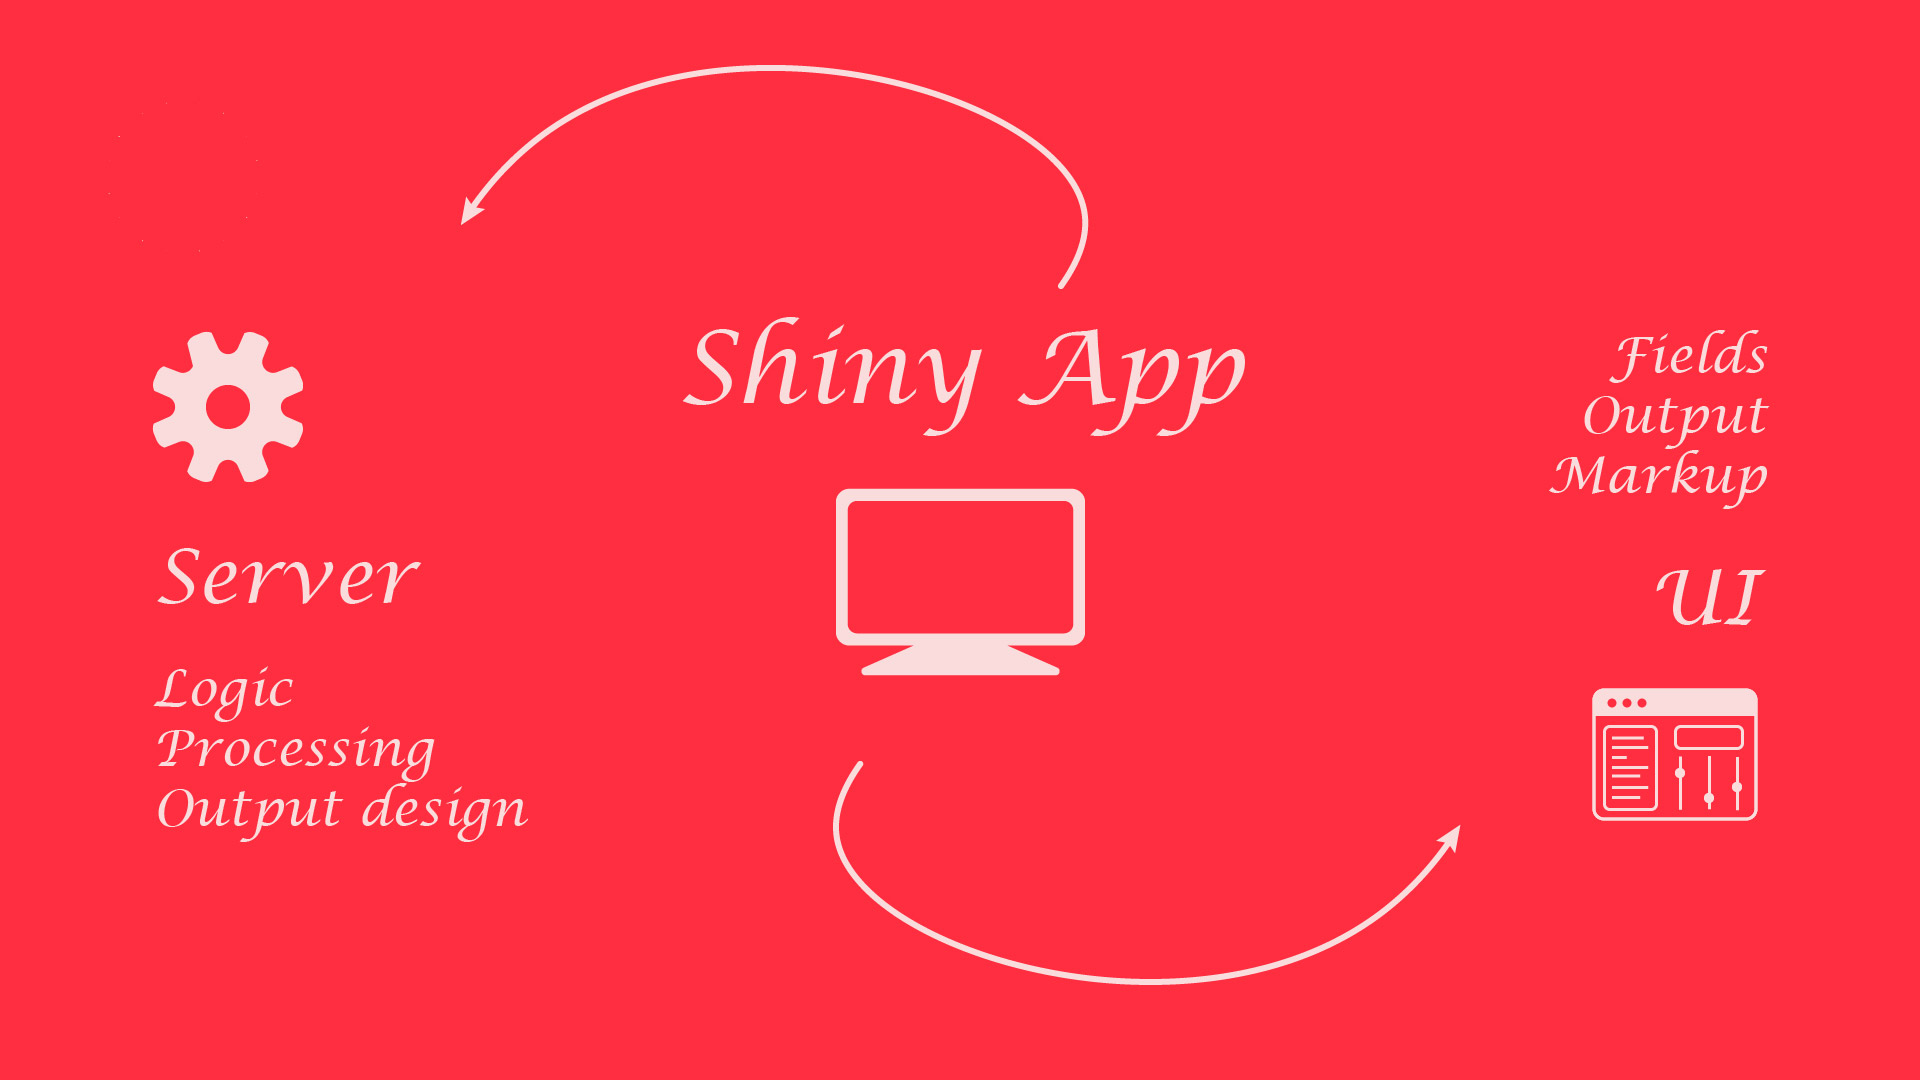
A shiny app is made up of two parts: a server and a user interface. In layman's terms, the backend and the front end. Each play a role and pass information between each other.
In practice, each of these is just its own file or separate block of code in the same file.
Server
The server is responsible for the logic of the application. That's where the data processing takes place and the output is designed.
Here are some examples as it pertains to my project:
- We can load in the population data and shapefiles in the server
- We can define a pipeline for transforming the data for the visualization
- We can design the visualization and prepare it for output
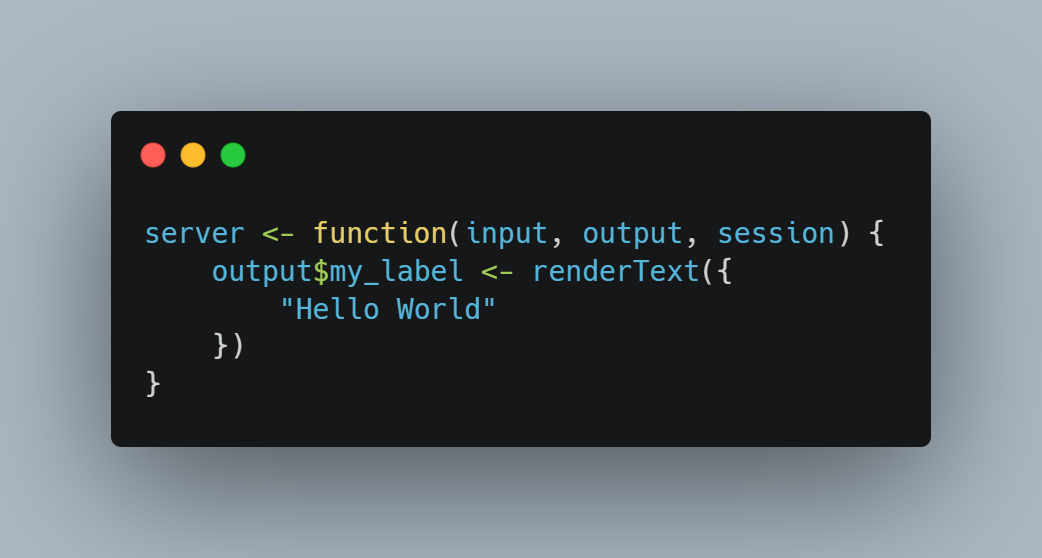
A basic server file or block contains a bunch of normal R code wrapped in special functions. Below is a simple example:
Here are some examples of functions we can use in the server file:
- Output: code wrapped here can be accessed by the UI file
- Reactive: code here will respond to updates and changes throughout the program
- Observe: code here will execute upon observing certain events
User Interface
The user interface is responsible for presenting data to the user and providing friendly tools to interact with the program. It's where we design the layout, the input fields, and display output.
Here are some examples as it pertains to my project:
- We can create an input field where the user can select a state they want a map for
- We can markup the interface with titles, descriptions, and instructiosn
- We can display the final plot to the user after the server is done with it
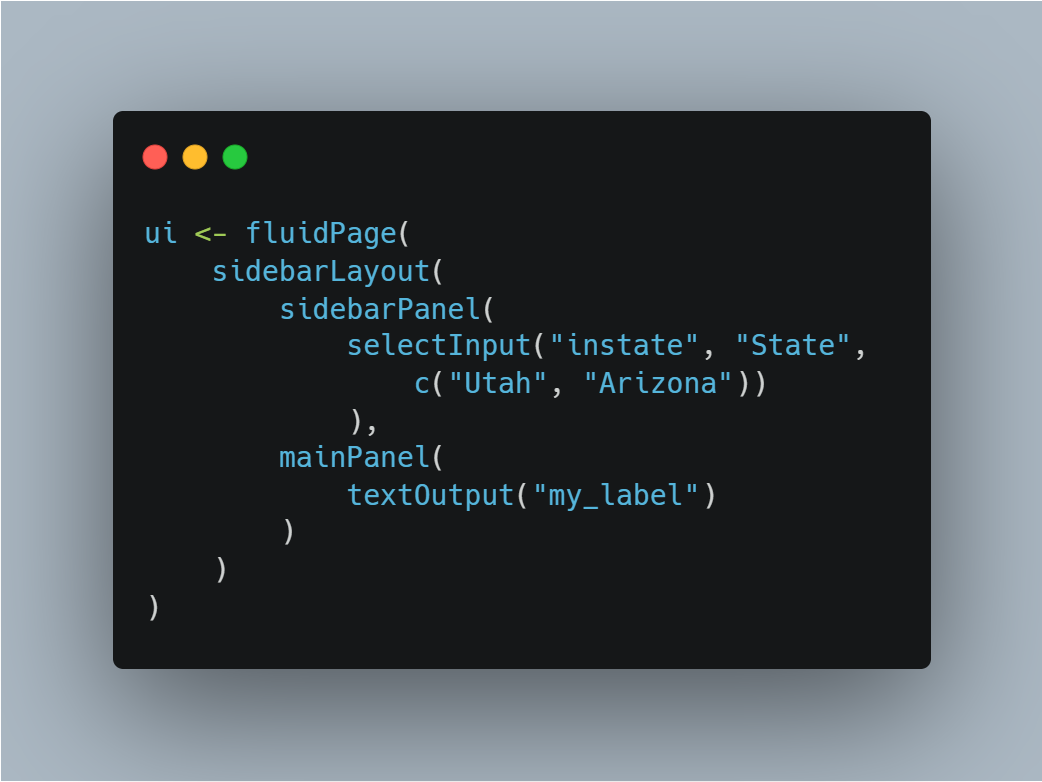
A basic UI file or block contains much less normal R code. Instead, special functions designed for R will make our interface dreams a reality. Below is a simple example:
Here are some examples of functions we can use in the UI file:
- Input: these allow the user to interact with the program
- Render Output: outputs defined in the server will be rendered to the user
- HTML Tags: we can use traditional HTML markup with simplified R functions
- Layout: there's a lot of functions that allow for custom layout designs
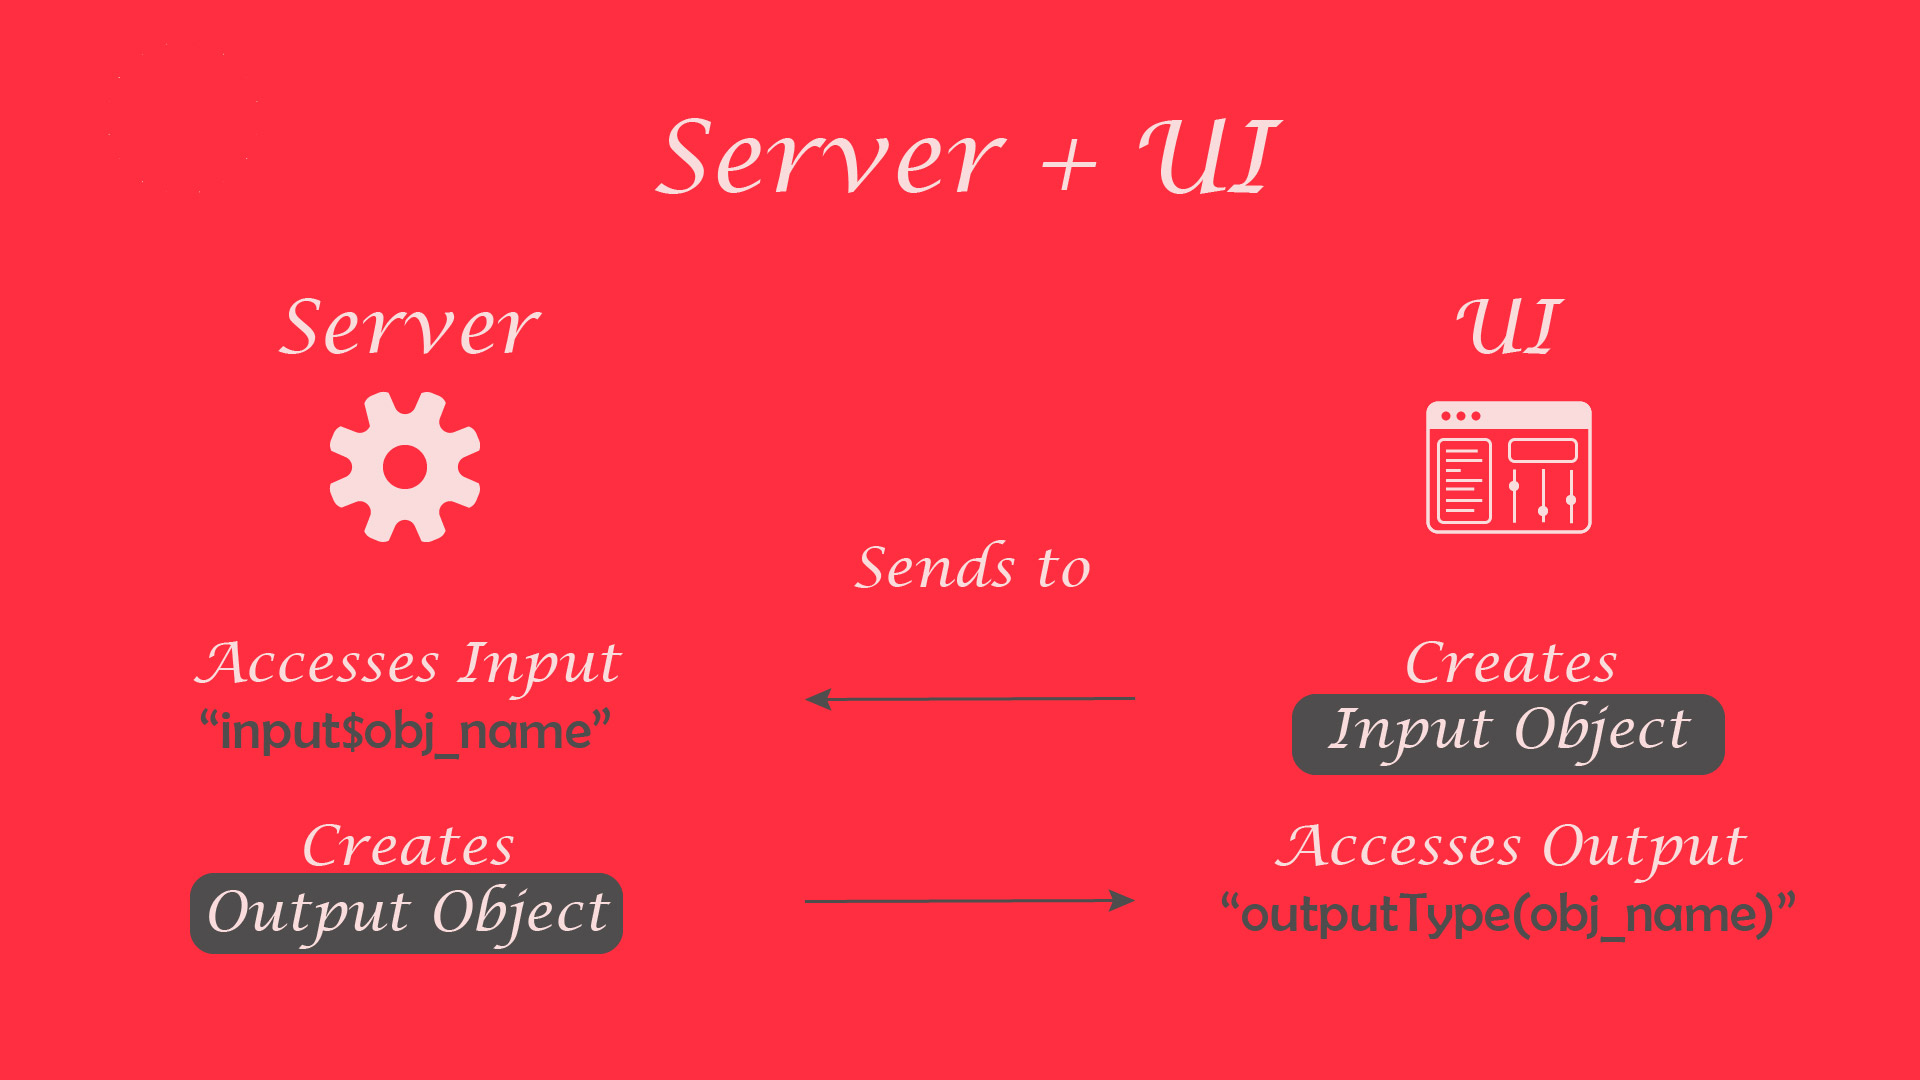
How They Work Together
The server and UI work together using the input and outputs. We'll define the former in the UI and the latter in the server, identifying them with custom ids.
Here's an example with code blocks for the ui and the server:
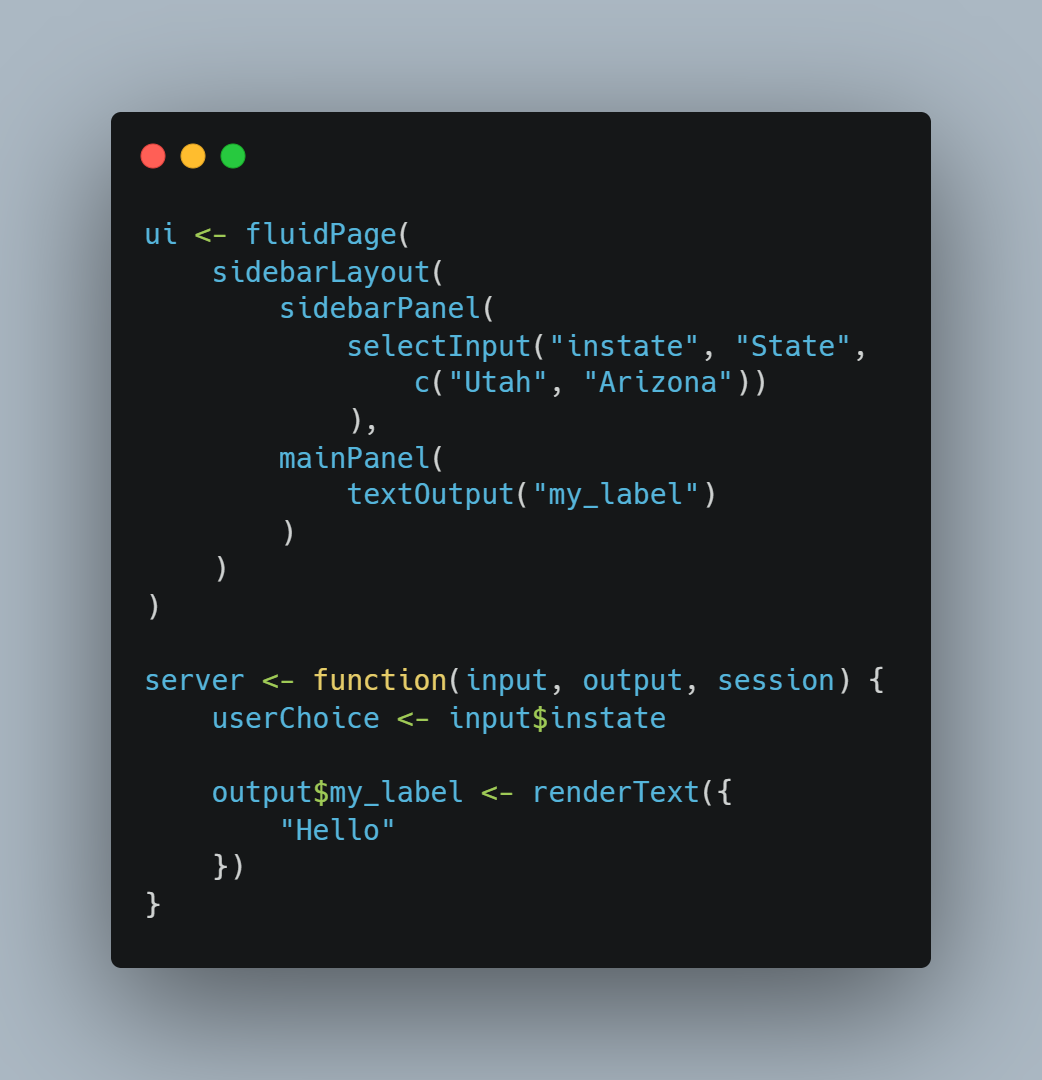
We created an "input" in the UI called 'instate' where the user can choose from some predetermined options. In the server, we referenced that with "input$instate" and saved it to a variable 'userChoice' local to the server.
We also created an "output" in the server called 'my_label'. In the UI, we referenced it with "textOutput". Outputs and inputs pass between the server and UI, completing the program.
My Implementation
For my app, I have a fairly straight forward implementation:
On the UI side, I'll use a side panel layout with a tab bar. We'll have some basic label markup and single selection input where the user can choose a state. In the main panel, we'll have a plot output for the visualization.
On the server end, we'll load in some population and shape file data, implement a transformation pipeline for format and to filter for the state, and prepare the visualization.
Take a look at the code for the project on GitHub. You'll notice the app.R file containing the UI and server code blocks.
There were some interesting components of this implementation and some things I learned along the way I wanted to detail below:
Layout & Theme
Thanks to {shinythemes}, a Shiny extension package making it easy to use bootstrap themes, I implemented a grayscale theme as a simple test.
Packages for Data
Thanks to the {tidycensus} package, it was easy to get county population data for the program.
Also, shape files were gathered quickly with the {tigris} package and we plotted them with the {sf} package using the {ggplot2} framework of visualization.
Demo
Take a look at the .GIF below for a short demo of the completed program!
At this point, I'm not too concerned with deploying an app to the R Studio Shiny Server so it accessible via a URL. I will learn and document deploying Future projects that are more worthy of sharing with the public.