D3 Learn & Practice
Charts and graphs caputure the visual senses to communicate information in an engaging way. Many consume such visualizations via the web so I aimed to develop design skills with D3.js.
Project Introduction
Data visualization may be one of the more underappreciated components of data work.
Not in that people don't think its valuable or use it in their projects. No, I find it extremely underrated due to three factors I have regularly witnessed in educational, professional, and personal projects:
- Visualizing data is common for most ever discipline in the data industry, whether internal or externally facing
- Visualizations are haphazardly designed and shared, without careful consideration for data, audience, and message
- Interactive visualizations are seldomly leveraged as the appropriate medium to hook audiences long term

I've fallen prey to these and other pitfalls throughout my career. However, this year I read Alberto Cairo's How Charts Lie and gained greater awareness, appreciation, and respect for this important art form.
Situation
Having begun a new professional opportunity with University of Utah Health, I've become more committed to developing my skills in data visualization. My goal has been to widen my hard skills (in this case with D3) and concentrate deeply on the subtleties of design to ensure ethical, impactful communication of insights.
Task
I embark on the journey of learning to design visualizations on the web using D3.js, a library for manipulating elements in the browser that facilitates highly customizable visualizations.
D3 is notorious for its steep learning curve since it isn't a visualization library in the traditional sense. It's more akin to interacting with each inner working of the "grammar of graphics" concept.
Action
I took to learning D3 very much "on the job". While I certainly leveraged YouTube tutorials, online articles, and other resources, I learned so very much by taking a dataset and aiming to visualize its content by choosing a new chart to practice designing.
My early work and practice didn't look anything like the beautiful visualizations I envisioned designing. True to reputation, I faced a steep uphill climb.
Soon, however, I begun to understand patterns and build mental models for what the library did and didn't accomplish for visualization. My early, complete visualizations showed promise.
Result
After months of practice personally and professionally, I finally feel empowered by the library. While much learning remains in my future, including reading a new book by Philipp K. Janert D3 for the Impatient, I've designed some really interesting and unique visualizations with D3.
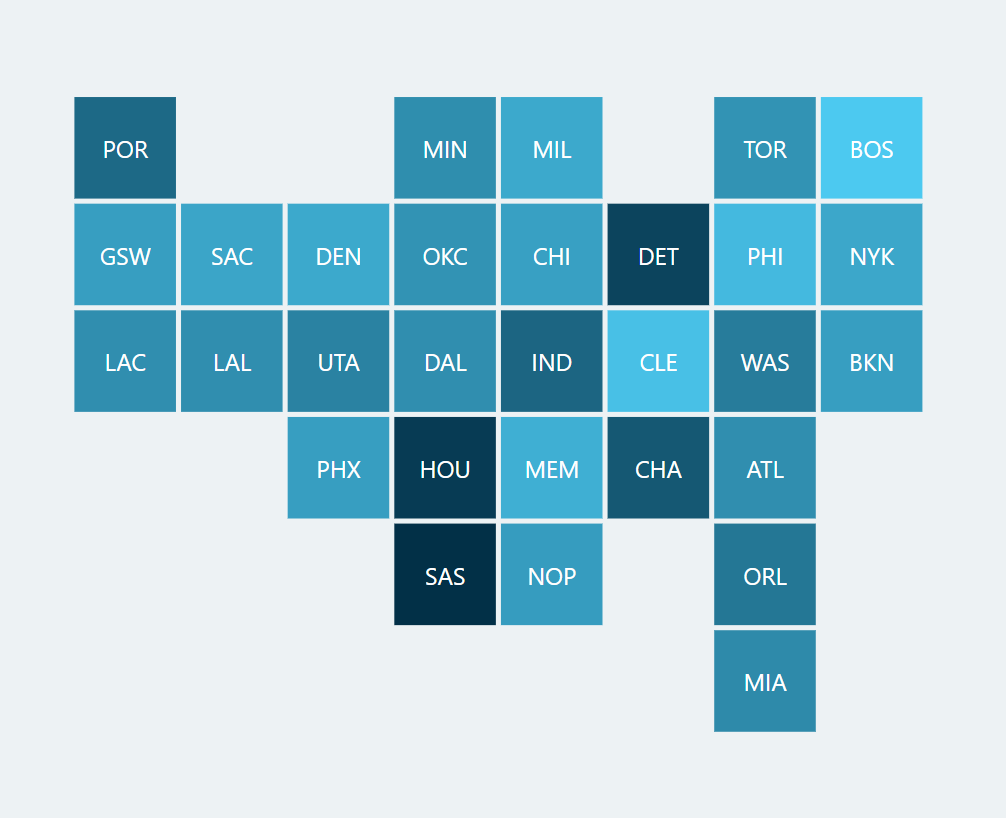
Here's an example of something I created recently to demonstrate the benefits of a tile map in lieu of a geographically true map when mapping variables to locations: