
Utah Jazz 3P Record Visualization
I design a series of visuals that debuted in a recent piece on SLC Dunk. I collected the data and designed vizualizations to storytell the history of the single-game, individual made three point shots in commemoration of the former record being broke.
Basketball has always been a large part of my life. In my early years, I'd frequently visit my grandpa and find him up in his office watching the Utah Jazz play. The fond feelings and memories there inspired a lifelong love for the sport.
I enjoyed my time playing in high school and recreationally into adulthood. I've since started my own podcast and contribute weekly to a Utah Jazz fan blog. My true passion in this area has shined forth as it affords me so many opportunities with the sports rich data resources.
On March 6th, 2022, a franchise record was broke by current roster member Bojan Bogdanovic. He made a franchise leading 11 three-point shots in a single-game by himself, besting the previous record held by Utah Jazz great Jeff Hornacek.
About this event I wrote a recent column for SLC Dunk (SB Nation affiliated Utah Jazz basketball blog) in which I researched the history of the record, stretching back to the debut of the rule in 1979. I collected the data and designed vizualizations to storytell the history in commemoration. You can read the full article here: Utah Jazz 3PM record: a history.
The remainder of this post will be less concerned with the history and record, but rather explain and highlight the process I undertook to create these storytelling visualizations. As a reminder, the blue link below the title of this post will navigate you to GitHub for the various resources I used.
Creating a Visualization
The visualization that I had in mind contained a lot of components: photo of the record holder, names of players who tied their record, dates, and other neat graphical elements. I decided that due to my time constraints, the best appraoch would not be using a plotting package. Instead, I decided to put my Adobe Illustrator skills to use and design the visuals from scratch.
The data I collected was static and possessed very few features that a plotting package would manipulate dynamically. Illustrator afforded me the ability to quickly craft my vision of a timeline sort of visualization and implement the aesthetics I wanted. Below you'll find the completed design:

I incorporated various elements into this design. I used the "shape builder tool" to craft the icons on the timeline that signify a record breaking event. I chose a unique font, played around with various font weights and styles. I incorporated the new franchise brand color pallette: black, white, yellow, and grey. I added photos of the record holders, name labels, and the team logo.
A clipping mask was used to tie all the elements and layers together prior to choosing the export settings. I chose the settings I felt appropriate for high enough resolution for the use of these assets (intended only for screen use).
I recorded a time-lapse of creating the visualization, which you can find below:
Creating the visualization was a lot of fun and challenged me in various ways. It required scaling all of the elements in order to really demonstrate relative time. For example, the timeline spanned 1979 to 2022. It was crucial that all record breaking events were placed appropriately on the timeline.
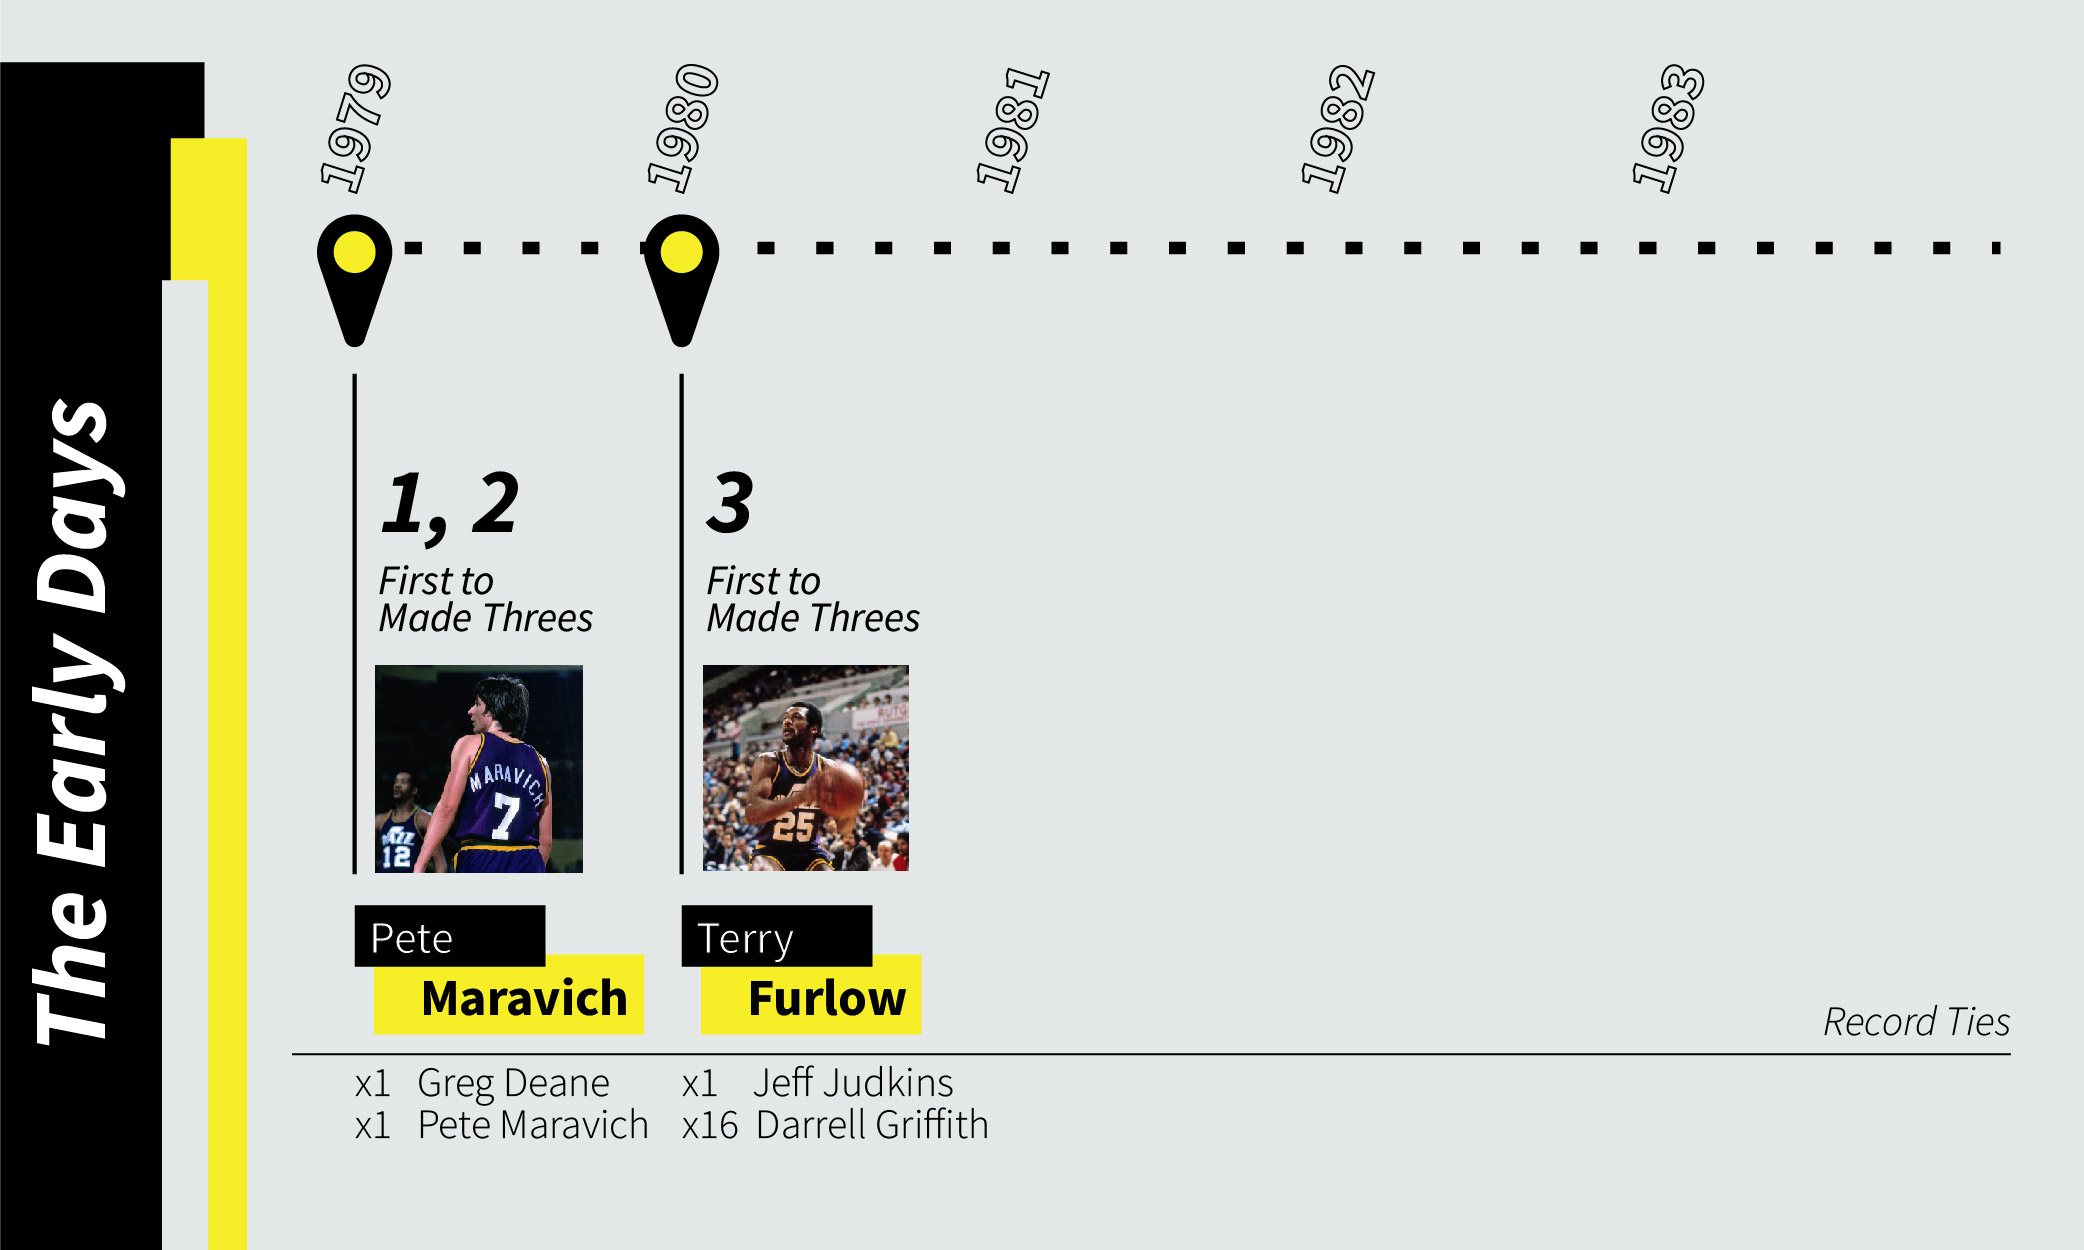
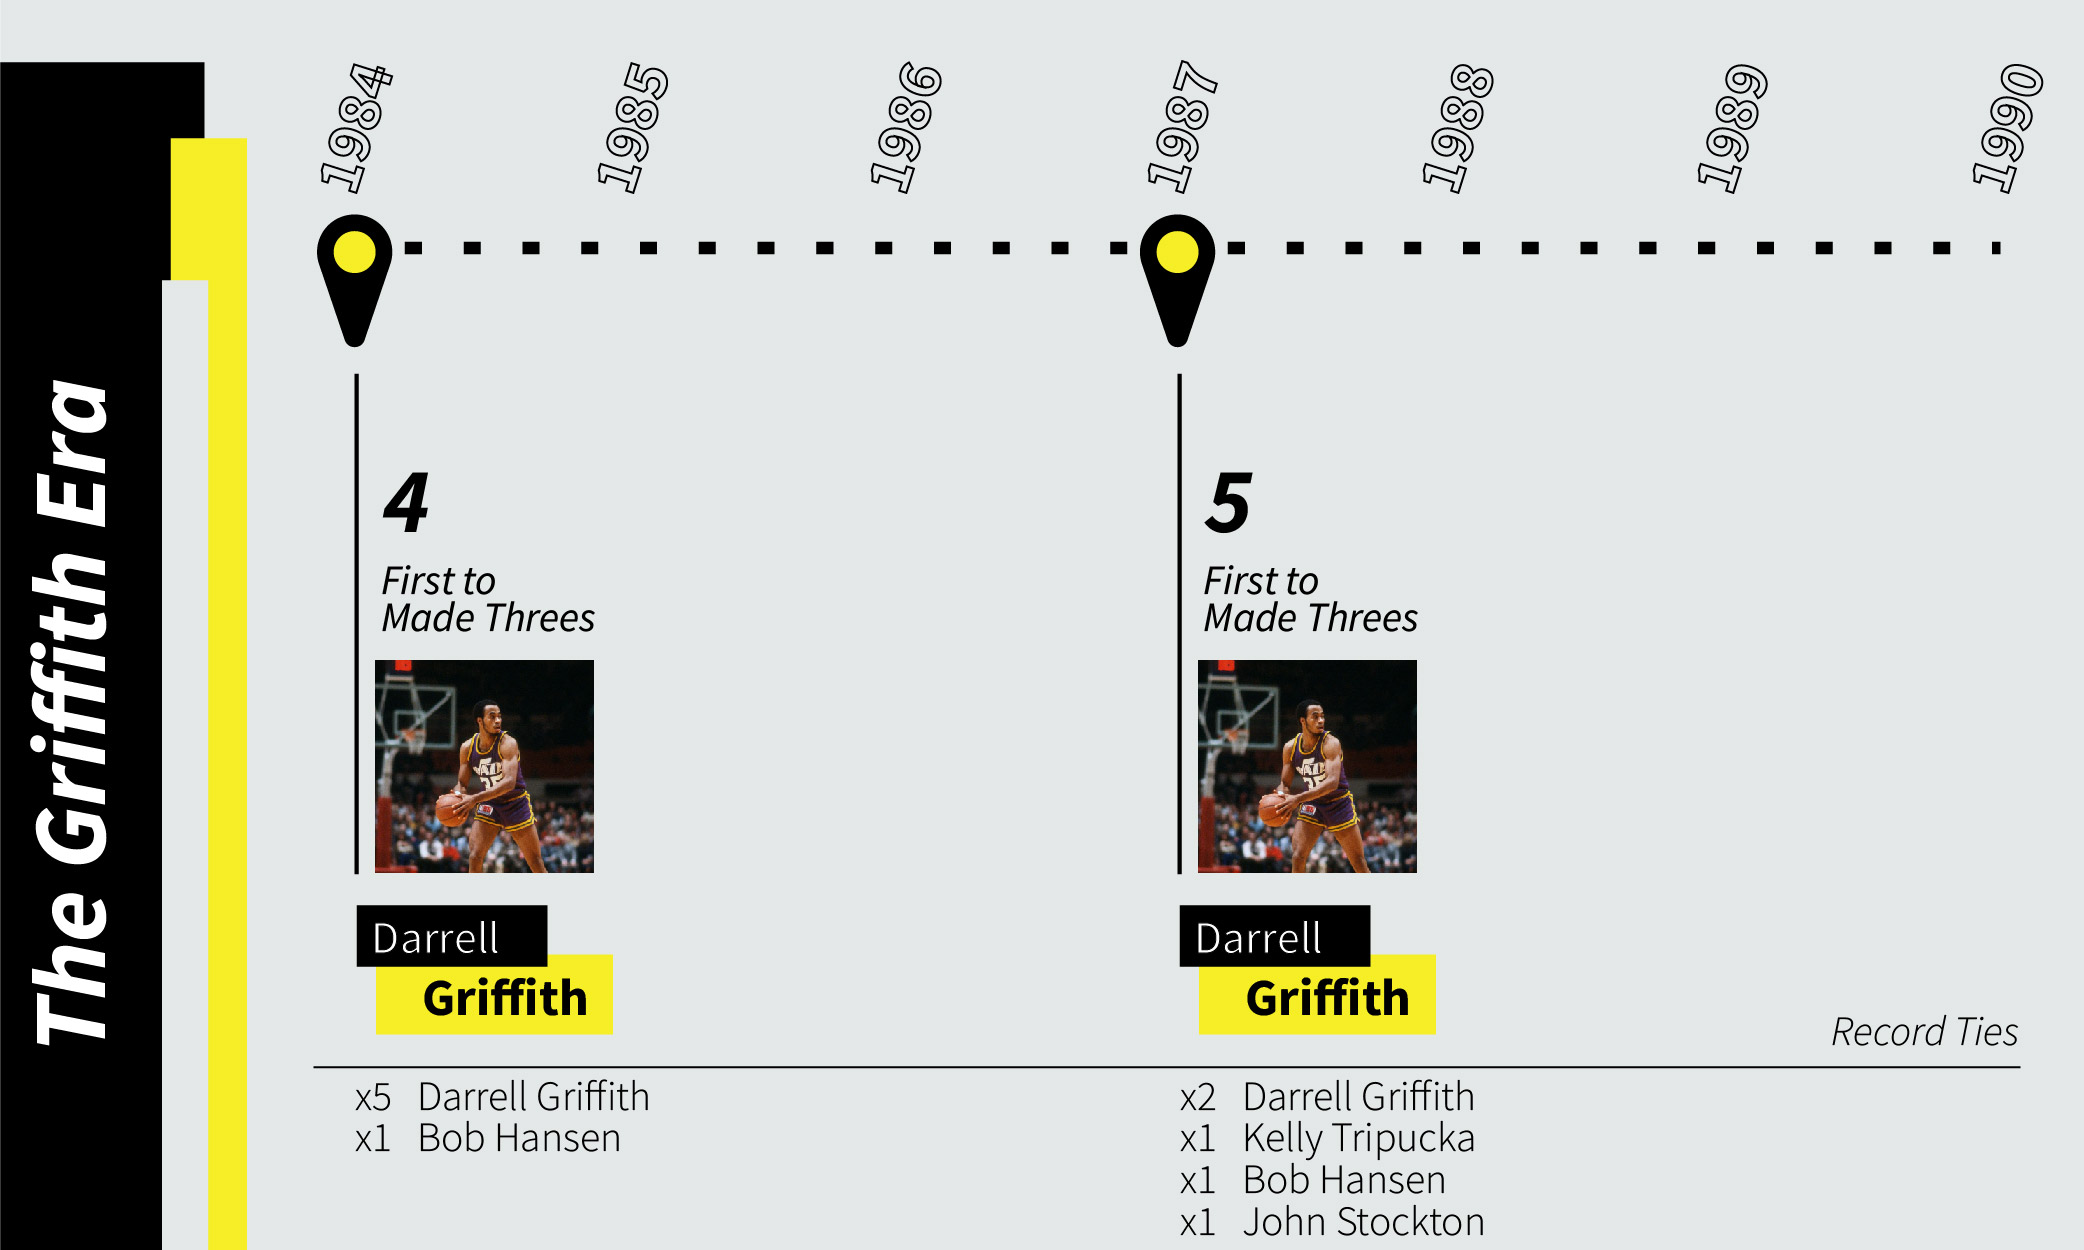
In addition to the main visualization, I designed three additional assets that expand what I identified as the three "eras" of this record: "The Early Days", "The Griffith Era", and "The Drought". You can see those individually below:
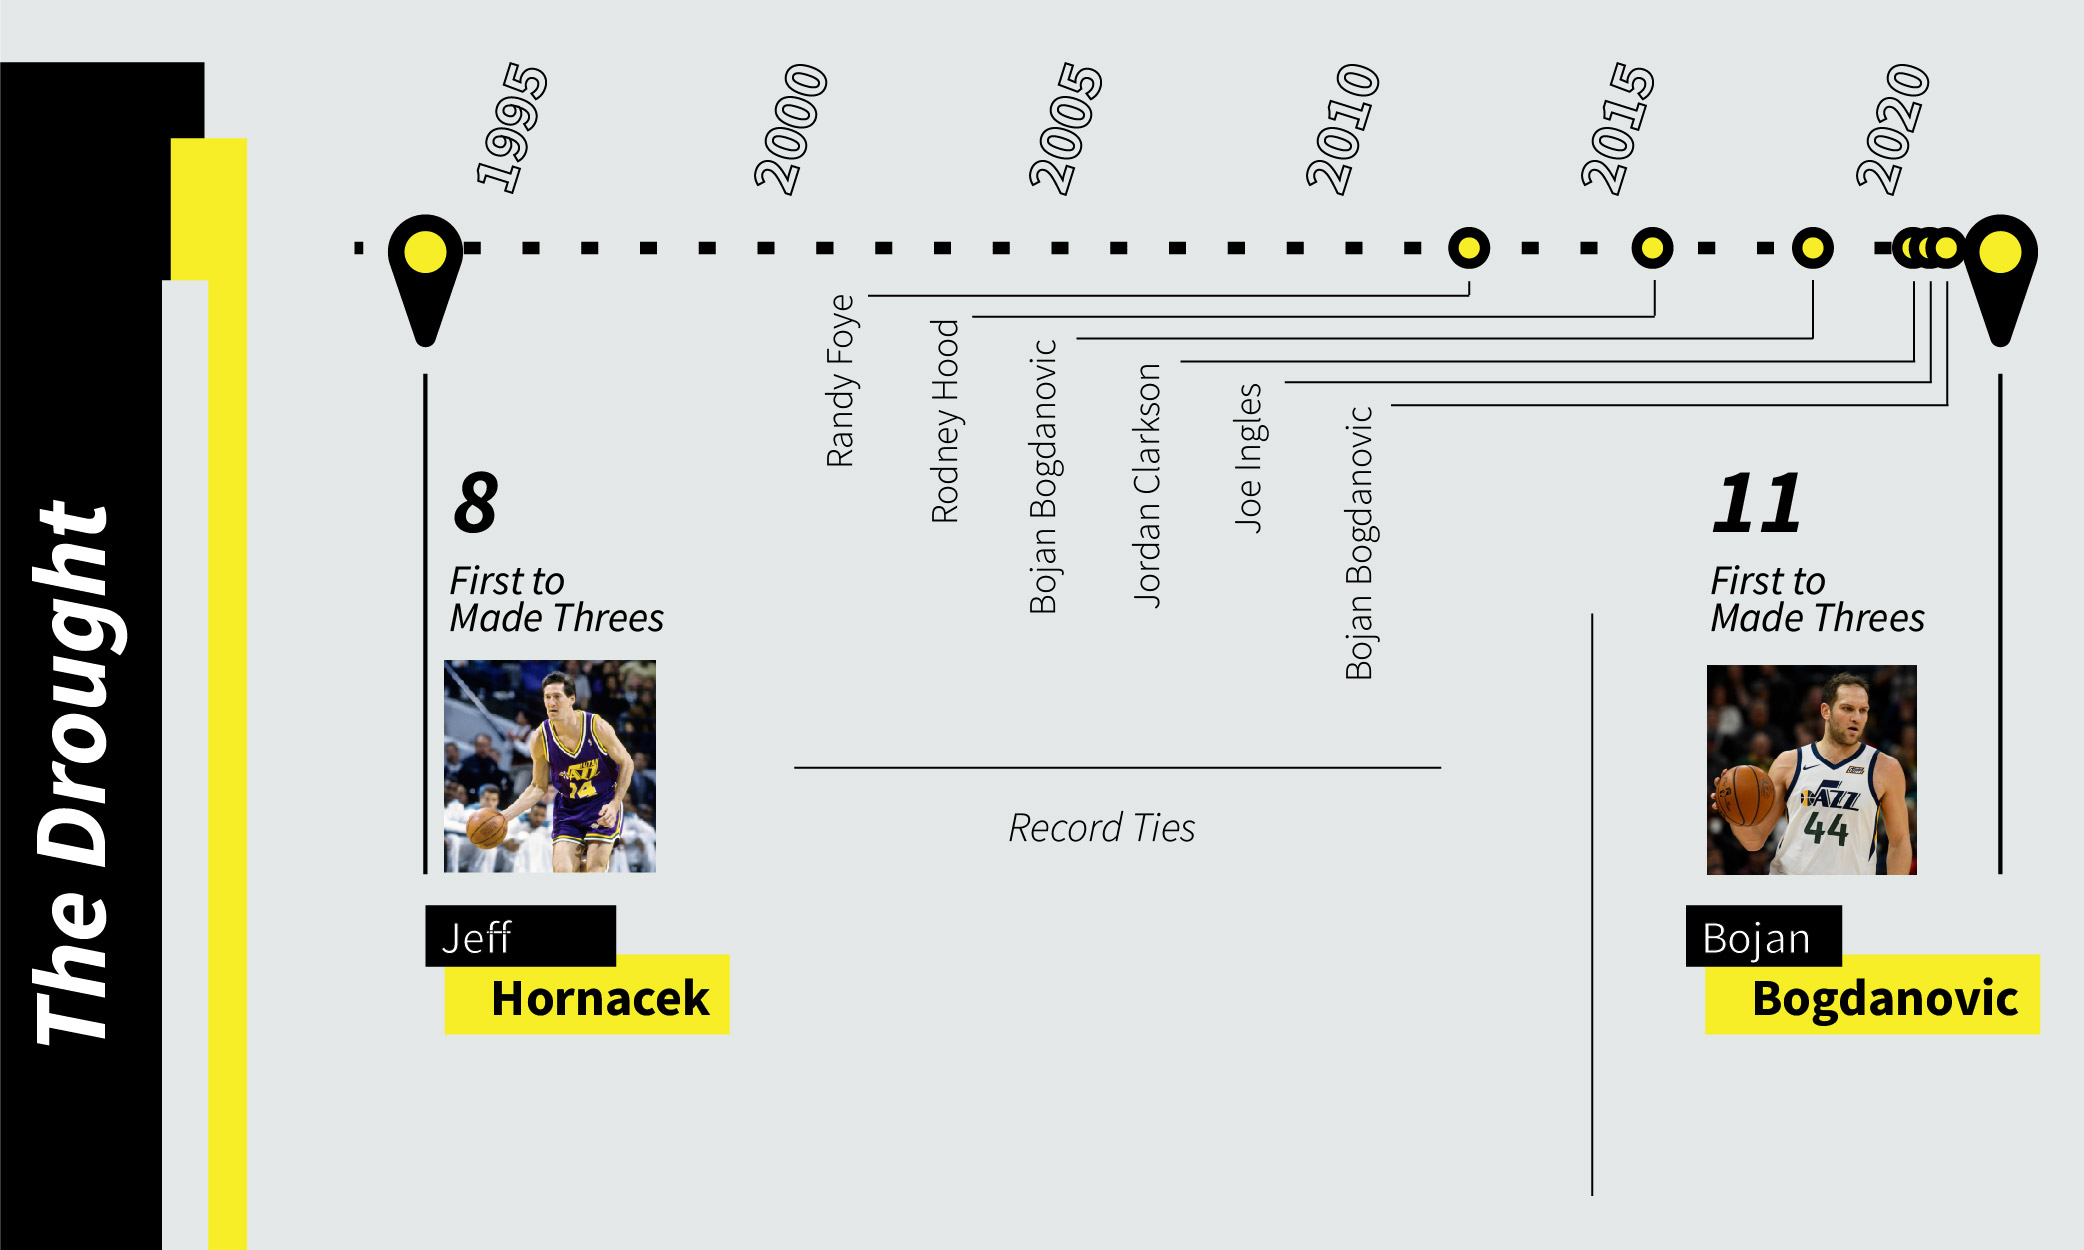
The most fun and interesting of the three is "The Drought", where it becomes very obvious that nearly three decades passed before the record was finally broken. I also highlighted effectively the increased emphasis that the Jazz and the league have placed on the three-point shot. The frequency of tying the then record of 8 coincided perfectly with the three-point revolution.
Looking back, I do feel there was an opportunity that I didn't seize to use height in some way to demonstrate the magnitude of breaking the record. For example, demonstrating how Jeff Hornacek broke the record of 5 with his 8 and similarly how Bojan Bogdanovic broke the record of 8 with his 11. I also could have implemented some additional design elements such as a washed background to give some additional texture.
Overall, I'm happy with the result and recognize that the unique time constraint necessitated (and frankly afforded) the use of Illustrator and limiting some creativity.